-
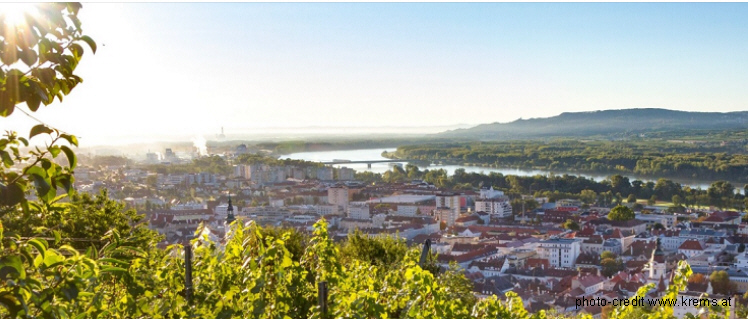
Host City Krems of 44. IAD Conference (6.Febr-9.Febr 2023), Austria: photo credit: Stadt Krems
-
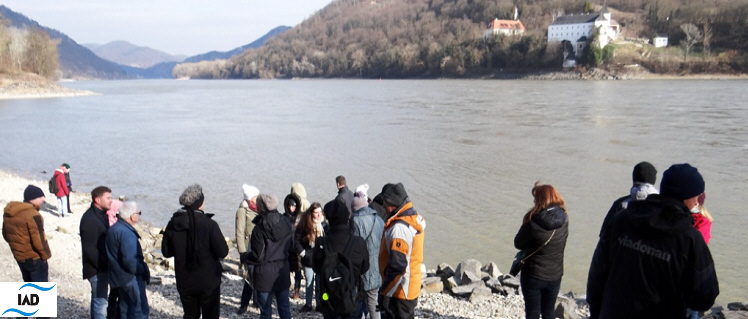
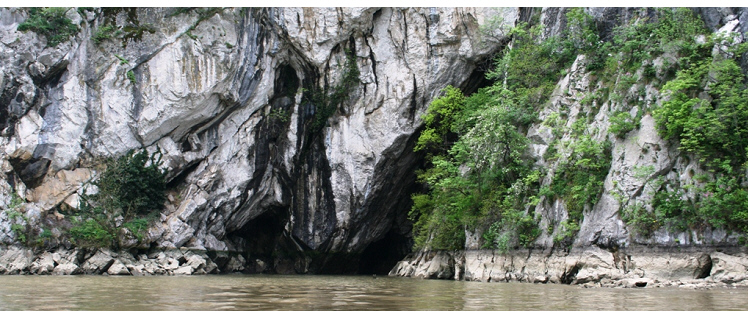
Danube River, 44.IAD Conf Krems (8.2.2023), Wachau, Austria photo credit: Віктор Вишневський (UA)
-
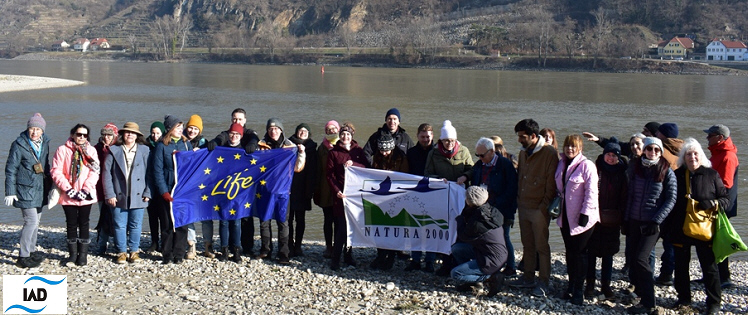
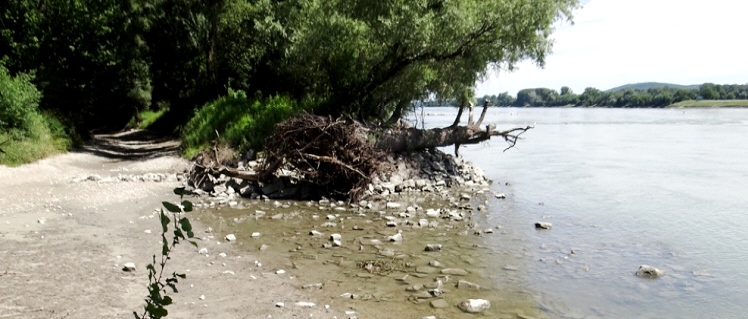
Danube River Excursion, 44.IAD Conf Krems (8.2.2023), Wachau (near Grimsing), Austria photo: K.Teu
-
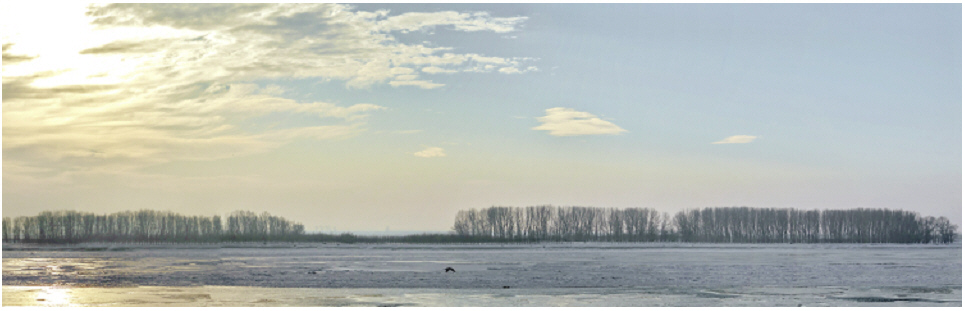
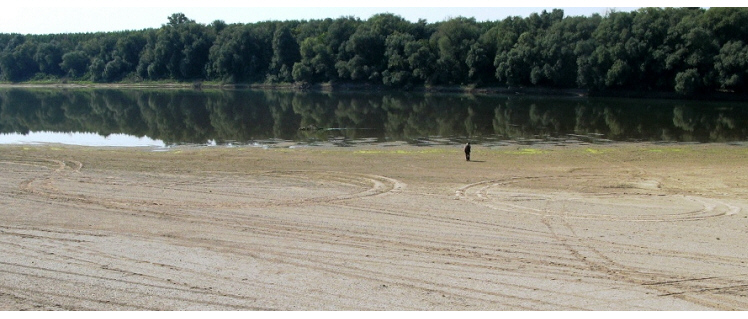
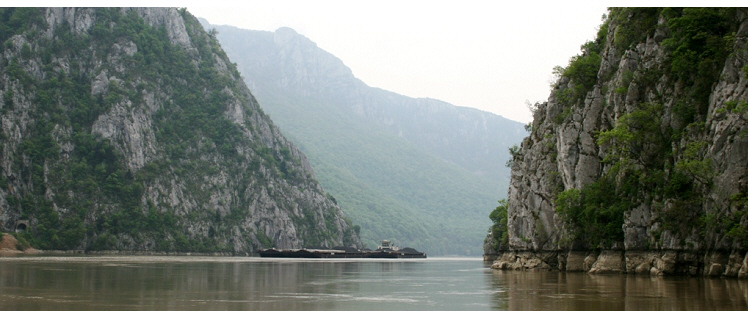
Danube stretch in winter mood, Romania, 2010 photo credit: Harald Kutzenberger
-
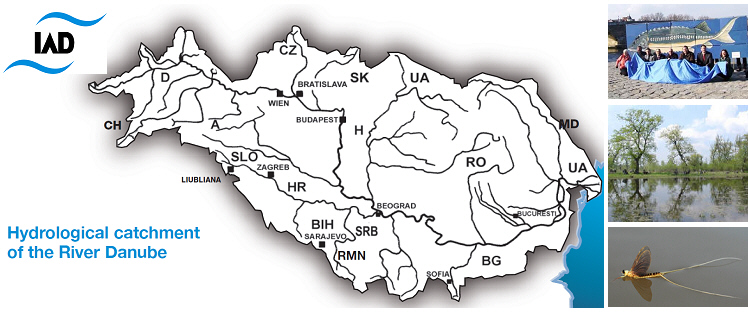
Map of the Danube River Basin and IAD-countries photo credit: several authors
-
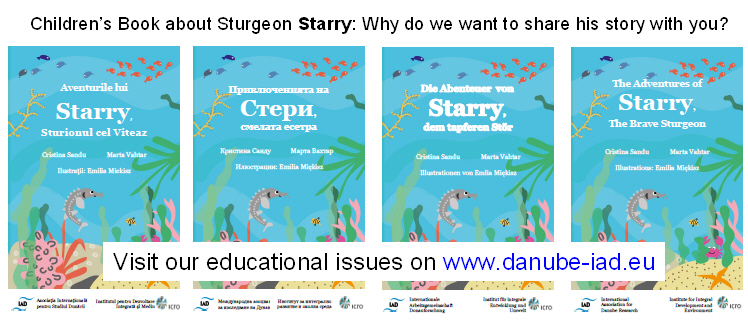
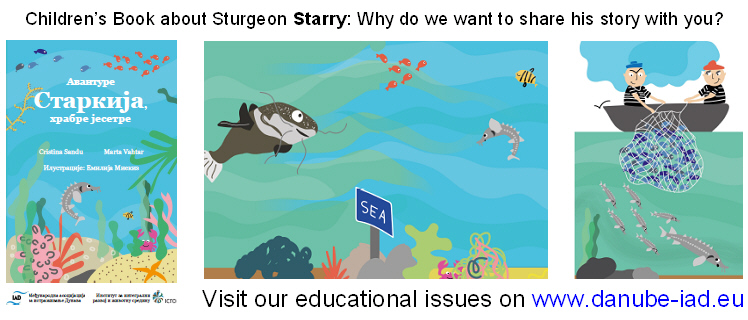
Children's Book by Sandu, Vahtar and Miękisz (2020), English Book & Translations credit: book illustrations
-

Children's Book by Sandu, Vahtar and Miękisz (2020), Multilingual Translations credit: book illustrations
-
Veľkolélsky island, Danube floodplain, Slovakia, 2022 photo credit: Katrin Teubner
-
Danube channel, Romania photo credit: Cristina Sandu
-

Children's Book by Sandu, Vahtar and Miękisz (2020), Translation into Romanian credit: book illustrations
-
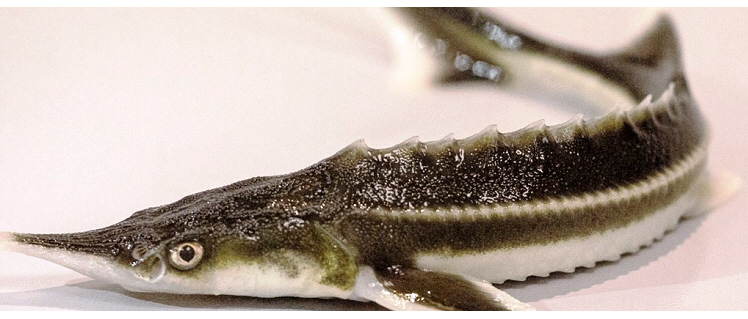
Sturgeon, Romania photo credit: Viorel Gavrila
-
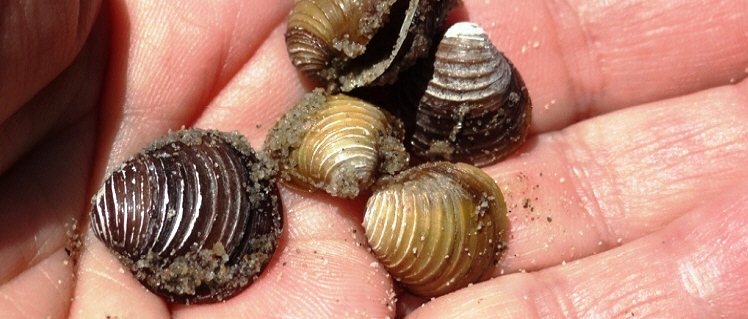
Veľkolélsky island, Corbicula sp., Slovakia. 2022 photo credit: Katrin Teubner
-
Veľkolélsky island, Slovakia, 2022 photo credit: Katrin Teubner
-
Danube sidearm near Gabčíkovo dam, Slovakia, 2022 photo credit: Katrin Teubner
-

Children's Book by Sandu, Vahtar and Miękisz (2020), English credit: book illustrations
-
Channel Danube Delta, Romania photo credit: Cristina Sandu
-

Children's Book by Sandu, Vahtar and Miękisz (2020), Colouring Books credit: book illustrations
-
Daube river at Bratislava, Slovakia, 2022photo credit: Katrin Teubner
-
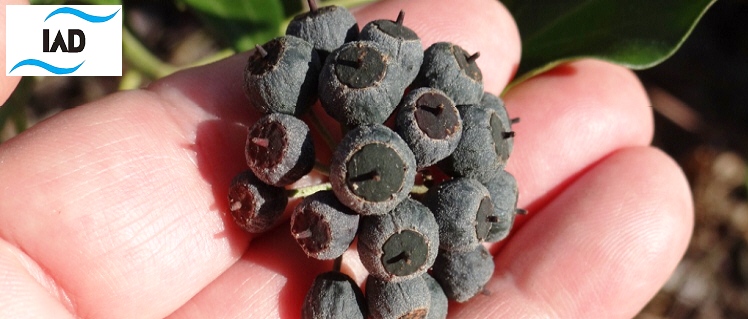
Danube River floodplain forest, Hedera helix, Austria, 2023photo credit: Katrin Teubner
-
Children's Book by Sandu, Vahtar and Miękisz (2020), Translation into Serbian credit: book illustrations
-
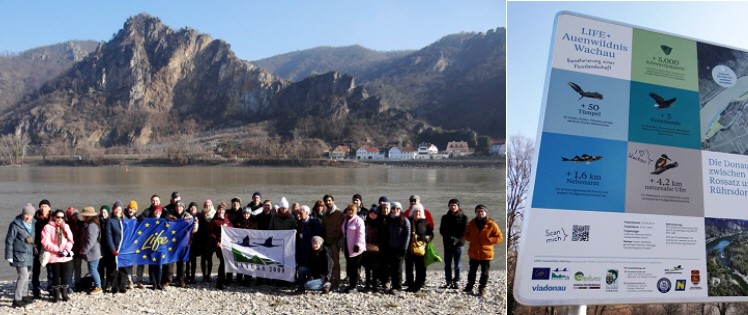
Danube River Excursion, 44.IAD Conf Krems (8.2.2023), Wachau (Rossitz-Rührdorf), Austria photo: K.Teu
-
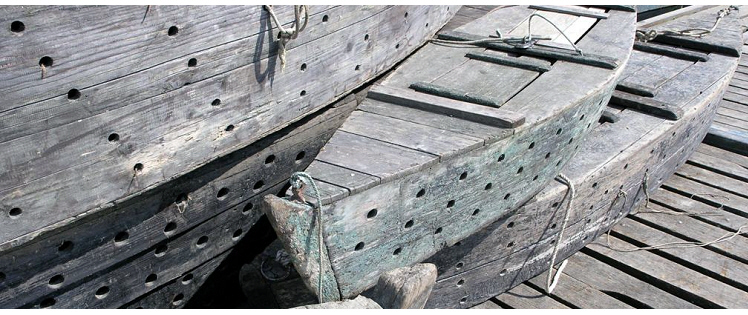
Fish catch boats in Gemenc, Hungary, 2007 photo credit: Katrin Teubner
-
Gemenc fishery, Hungary, 2007 photo credit: Katrin Teubner
-

Children's Book by Sandu, Vahtar and Miękisz (2020), Translation into Hungarian credit: book illustrations
-
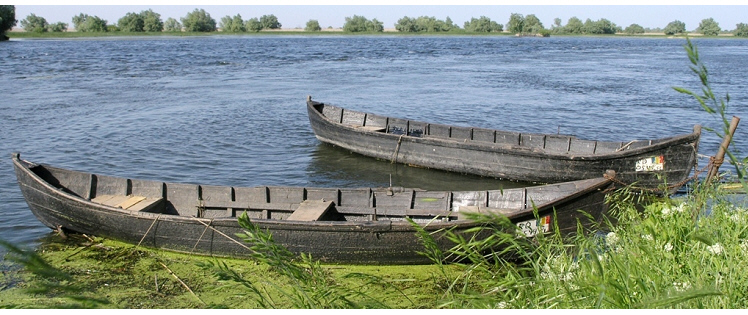
Fisherboats at village Mila, Romania, 2005 photo credit: Katrin Teubner
-
Fisherboat, Romania, 2005 photo credit: Nicolae S.P.
-
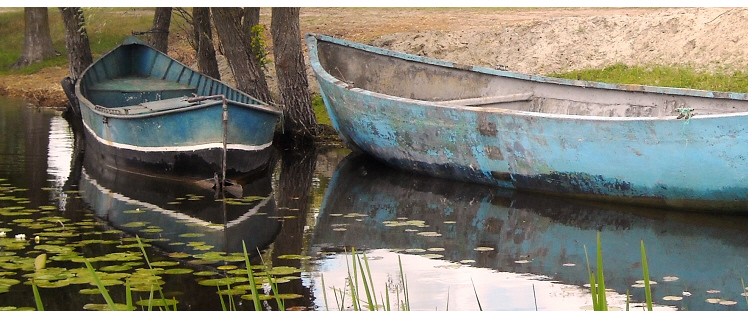
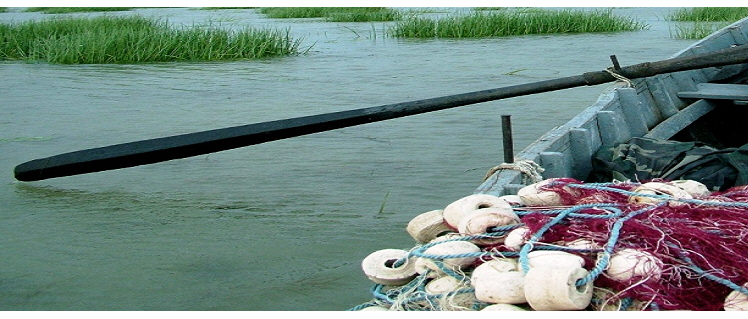
Fishermen boat, Romania photo credit: Cristina Sandu
-
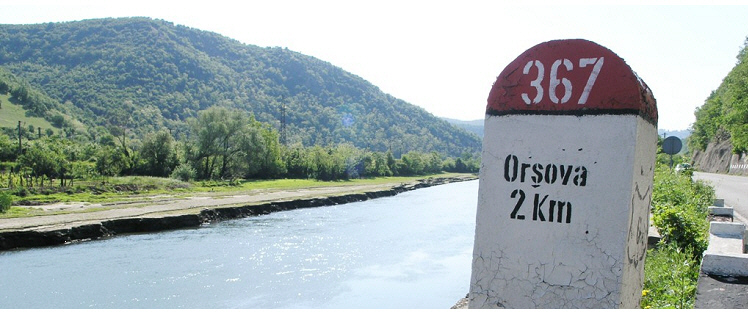
Danube stretch in Orsova, Romania, 2005 photo credit: Katrin Teubner
-

Hydromorphological assessment for Danube tributaries: Drava and Mura photo credit: Ulrich Schwarz
-
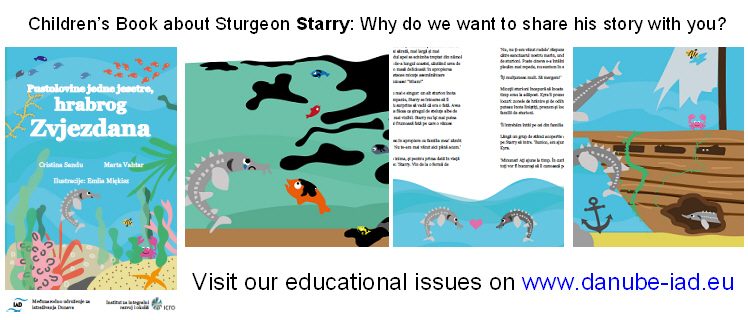
Children's Book by Sandu, Vahtar and Miękisz (2020), Translation into Croatian credit: book illustrations
-
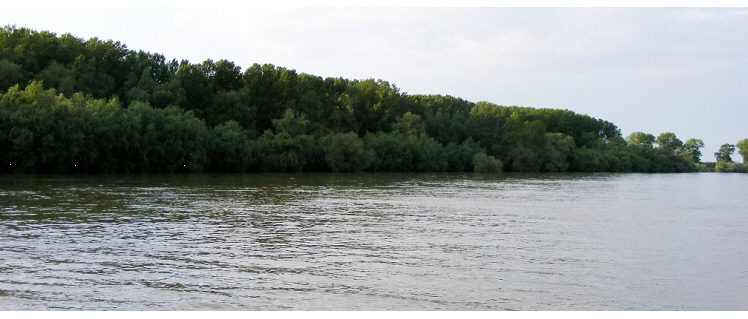
Danube stretch in Gemenc, Hungary, 2007 photo credit: Katrin Teubner
-
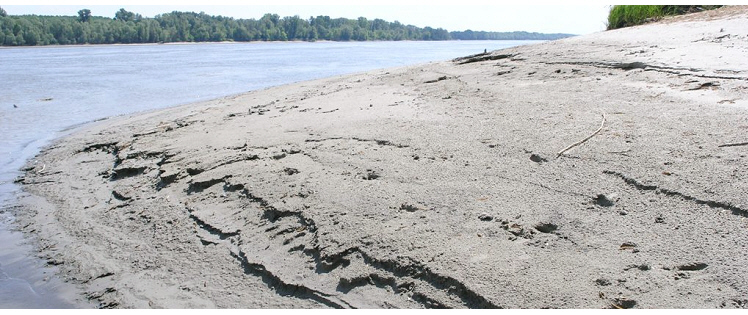
Danube side channel, Romania, 2005 photo credit: Nicolae S.P.
-

Children's Book by Sandu, Vahtar and Miękisz (2020), Translation into German credit: book illustrations
-
Danube Schönau, Austria, 2013 photo credit: Katrin Teubner
-
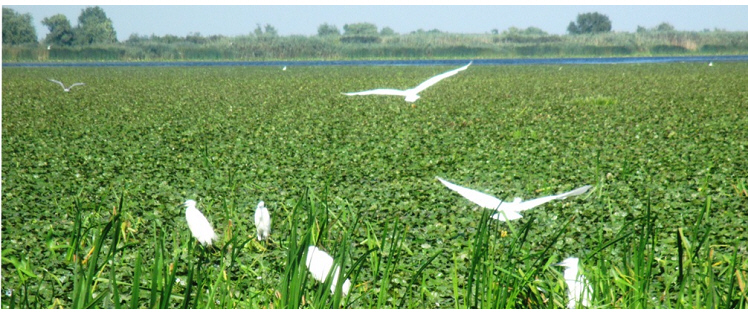
Egrets at Channel Danube Delta, Romania, 2016 photo credit: Cristina Sandu
-
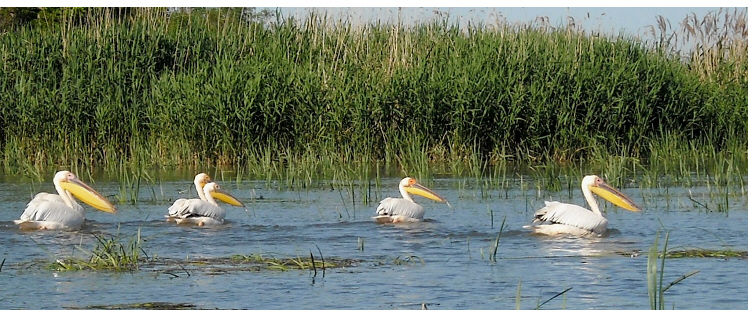
Danube Delta, pelicans, Romania photo credit: Cristina Sandu
-
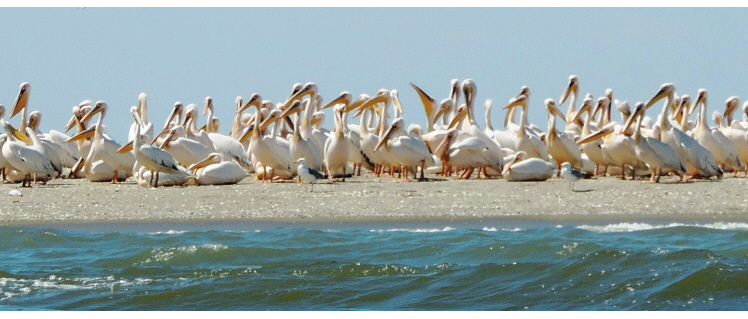
Danube Delta, pelican colony, Romania photo credit: Cristina Sandu
-
Veľkolélsky island, Slovakia, 2022photo credit: Katrin Teubner
-
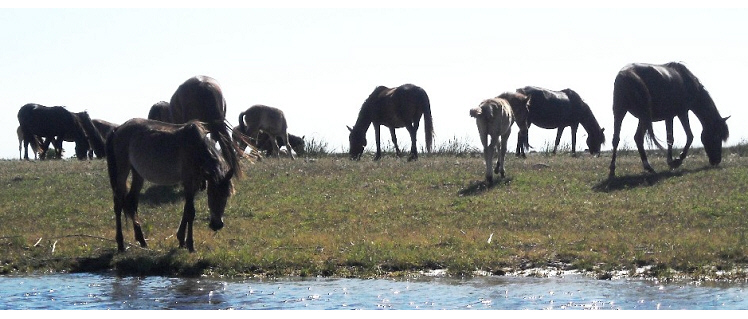
Horses in the Danube Delta, Romania photo credit: Cristina Sandu
-
Danube, Romania, 2005 photo credit: Katrin Teubner
-
Danube, Romania photo credit: Nicolae Găldean
-
Danube, Romania photo credit: Nicolae Găldean
-
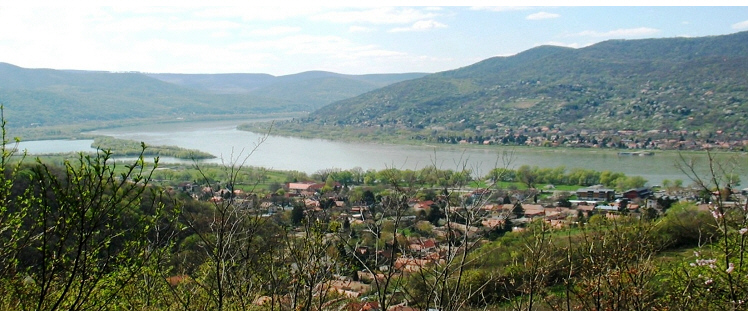
Danube at Visegrád, Hungary, 2019 photo credit: Mária Dinka
-
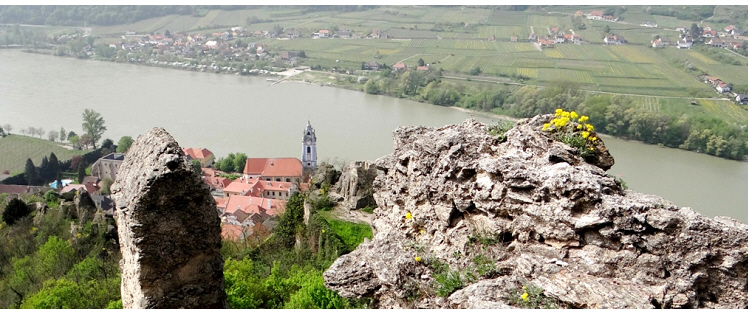
Danube stretch at town Dürnstein, Austria, 2013 photo credit: Katrin Teubner
-
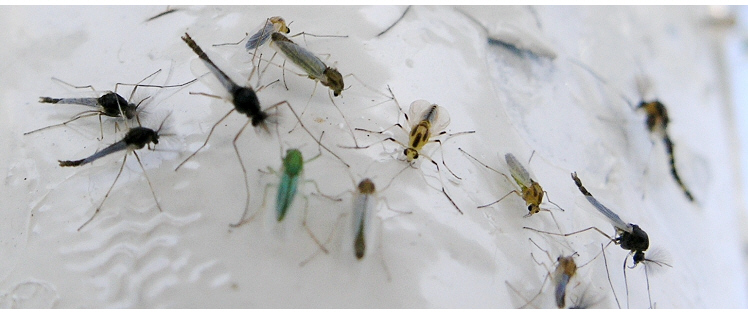
Danube Delta, Chironomidae at Lake Puiu, Romania, 2005 photo credit: Katrin Teubner
-

Children's Book by Sandu, Vahtar and Miękisz (2020), Translation into Bulgarian credit: book illustrations
-
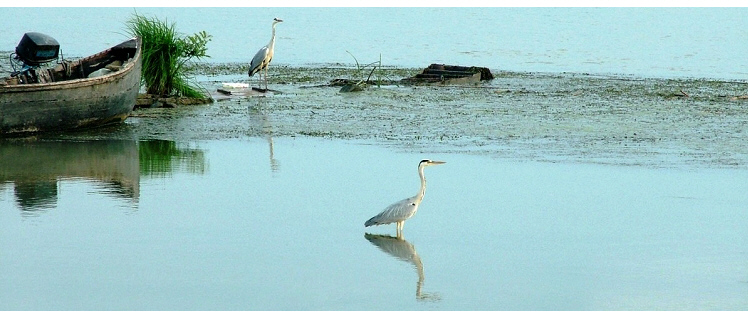
Danube Delta, Grey Herons, Romania, 2005 photo credit: Nicolae S.P.
-
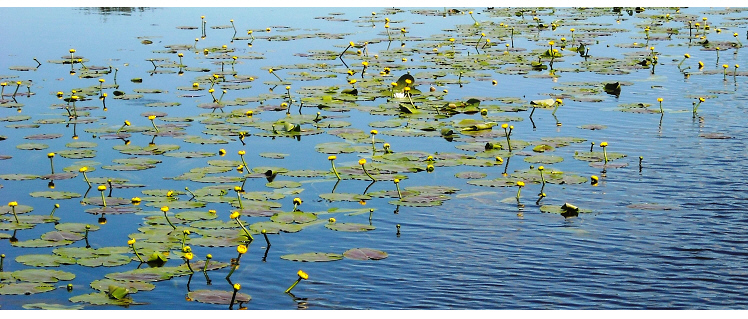
Danube Delta, Yellow Water Lily, Romania photo credit: Cristina Sandu
-

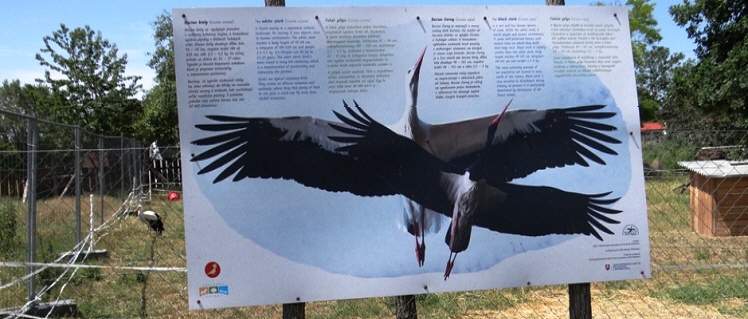
Danube Delta, stork nest, Romania photo credit: Cristina Sandu
-
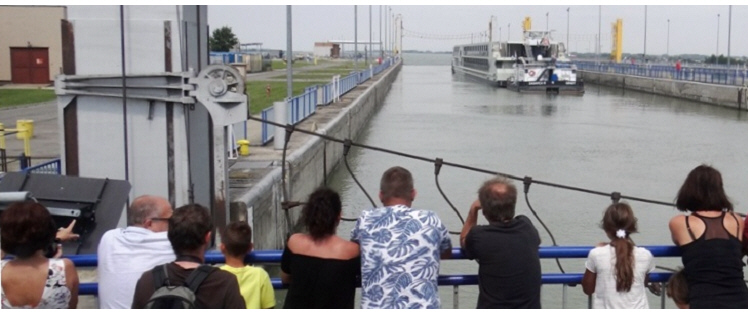
Hydroelectric power plant Gabčíkovo, Slovakia, 2018 photo credit: Katrin Teubner
-
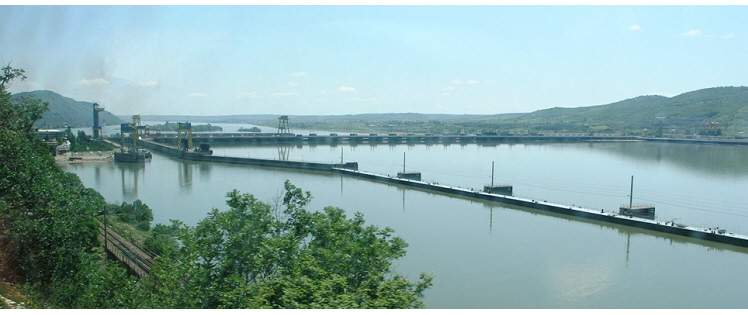
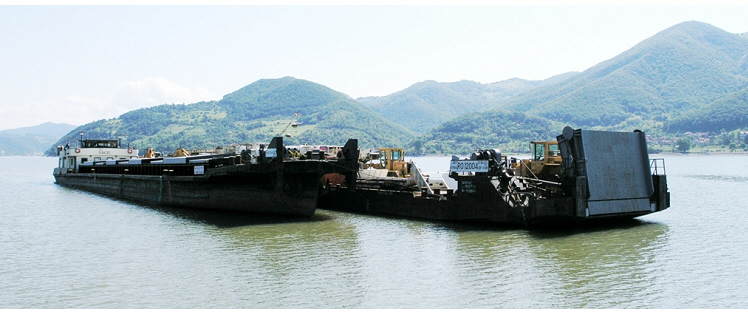
Iron Gates hydroelectric power plant, Romania, 2005 photo credit: Katrin Teubner
-
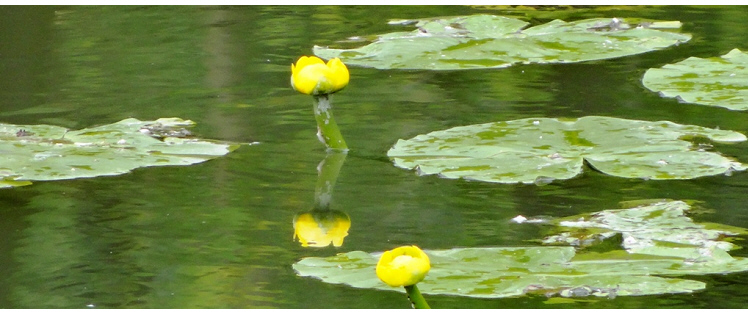
Macrophytes in the Danube Delta, Yellow Water Lily, Romania, 2005 photo credit: Katrin Teubner
-
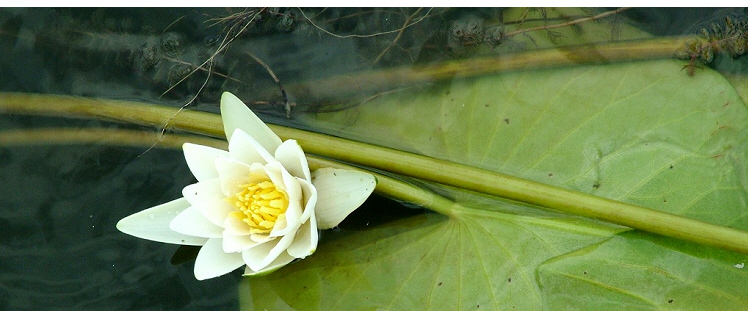
Channel Danube Delta, White Water Lily, Nymphaea alba, Romania, 2005 photo credit: Nicolae Ş.P.
-
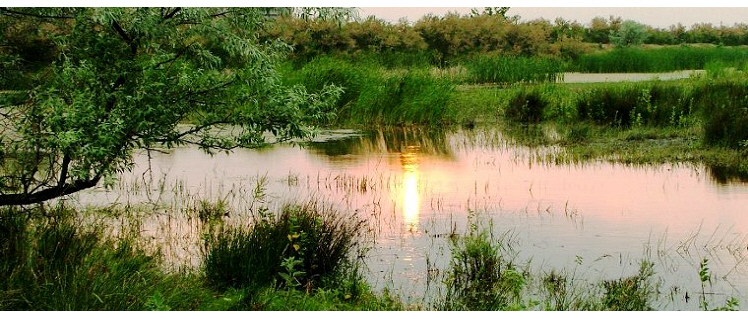
Floodplain Danube Delta, 2005 photo credit: Nicolae Ş.P.
-
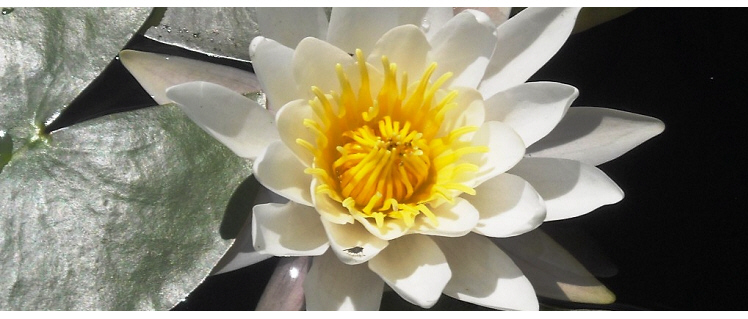
Danube Delta, White Water Lily, Nymphaea alba, Romania photo credit: Cristina Sandu
-

Children's Book by Sandu, Vahtar and Miękisz (2020), Translation into Ukrainian credit: book illustrations
-
Floodplain Danube Delta, egrets, 2005 photo credit: Nicolae Ş.P.
-
Floodplain Danube Delta, egrets, 2005 photo credit: Nicolae Ş.P.
-
Floodplain near Gabčíkovo, Slovakia, 2018 photo credit: Katrin Teubner
-
Iron Gates hydroelectric power plant, Romania, 2005 photo credit: Katrin Teubner
-
Alte Donau, Vienna, Austria, 2018 photo credit: Katrin Teubner
-
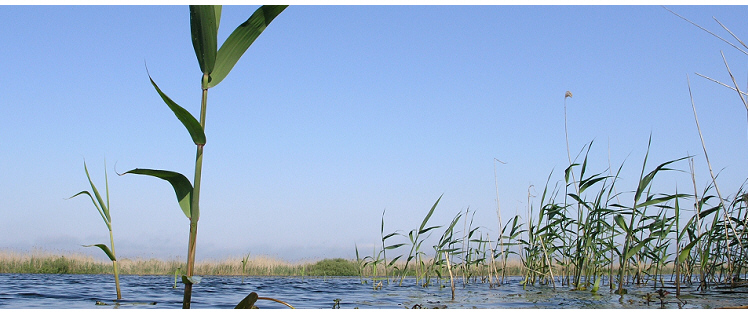
Phragmites australis in the Danube Delta, Romania, 2005 photo credit: Katrin Teubner
-
Channel Danube Delta, Romania, 2016 photo credit: Cristina Sandu
-
Floodplain at Gabčíkovo, Slovakia, 2018 photo credit: Katrin Teubner
-
Danube, Romania, 2005 photo credit: Nicolae S.P.
-
Danube, during low water level, Romania, 2005 photo credit: Nicolae S.P.
-
Hydroelectric power plant Grafenwoerth, Vienna, Austria, 2018 photo credit: Katrin Teubner
-
Danube, Romania photo credit: Nicolae Găldean
-
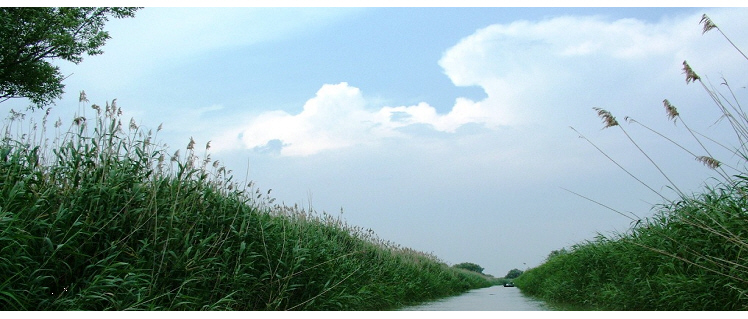
Phragmites australis in the Danube Delta, Romania, 2005 photo credit: Katrin Teubner
-
Channel Danube Delta, Romania, 2005 photo credit: Nicolae S.P.
Zooplankton/Zoobenthos
Fachgruppenleiter/Co-ordinator: Dr. Nándor Oertel (retired)
- Download this article [doc, 1 MB]
- Macroinvertebrate Expert Group Annual Circular Letter [doc, 300 KB]
- Professional and personal data of the Macroinvertebrate Expert Group [doc, 110 KB]
Sampling experiments of macroinvertebrates in the Hungarian section of the Danube
Introduction Increasing stress is laid on the macroinvertebrates as one of the most important compounds of biomonitoring used in river water quality assessment. All over the world water management extensively uses biotic indices and biotic score systems based on macroinvertebrate communities. At the same time, a lot of fundamental and methodological questions concerning the applicability of the species and/or communities in question and the conditions in which the results of bioindication are valid and interpretable in large rivers have been under elaboration. The role of the macroinvertebrates in small or medium size river ecosystems is well known and fits to the continuum concept of VANNOTE et al. (1980). In the case of large rivers, such as the Danube, discontinuity comes to the front and some conceptual and methodological considerations of the continuum concept can only be used with reservations (SCHÖNBORN 1992). In the large rivers both the great dimensions and the significantly fluctuating water regime are primary factors of discontinuity. The human impacts, like regulation, canalisation or damming, having effects on the current situation or causing fragmentation, are superimposed on this discontinuity (DYNESIUS & NILSSON 1994).
The use of macroinvertebrates in water quality assessment has several advantages. These organisms occur in a great variety of species and in large quantities, they play significant role in energy cycling and mass balance, and represent the widest scale of taxonomic groups and functional feeding guilds. In this wide range of diversity sensitive indicator species can be found as well (UN/ECE 1995). The shortcoming of the water quality assessment based on hemihidrobiont aquatic organisms is that its applicability is season dependent. Heterogeneous distribution and the processes in the background of heterogeneity (drift, migration, invasion, colonization, adaptation) could also be disadvantageous. The routinely used quantitative samplings of most of the macroinvertebrate taxonomic groups are not sufficiently clarified. Collecting of native organisms in the profundal region of a large river is difficult, in the littoral zone is accidental because of the very changeable water level. The periods of sampling in the littoral zone are rather limited. In a normal hydrological year late spring or early summer and autumn could be advisable periods for yearly monitoring. Using appropriate references in time or space, semiquantitative methods and techniques based on the relative abundance and artificial substrates, a part of the shortcomings can be removed. In large rivers, the reliable application of macroinvertebrates for monitoring of water quality requires the preliminary knowledge of routinely usable field techniques, faunal database of species level, habitat typology and spatio-temporal patterns of the macroinvertebrate communities.
Some of the results as examples of methodological investigations elaborated in the Hungarian Danube section are coming next.
Comparative analysis of qualitative, semiquantitative and quantitative sampling methods
The routine water quality assessments based on the analysis of macroinvertebrate communities, use qualitative and/or semi quantitative techniques for sampling and estimate quantities based on the figures of relative abundance (DE ZWART & TRIVERDI 1992, TITTIZER 1999). To calculate the saprobic and biotic indices and to determine the percentage of the functional feeding groups in the material and energy balances, quantitative data are needed. The quantitative sampling in large rivers meets with some difficulties and the treatment of samples is labour and time consuming. Efforts were taken in order to specify the applicability and effectiveness of the widely used quantitative and semi quantitative sampling methods for the collection of different macroinvertebrate taxa living in the littoral zone of the River Danube.
Samples were taken on two sections of the Danube Bend (Hungary), which are different in their hydrology and material cycling. At Kismaros (1688 river km) the river has a deposition zone with soft sediment rich in organic material, while the hard substrate at the erosion zone of Göd (1669 river km) has gravel (Fig. 1.).
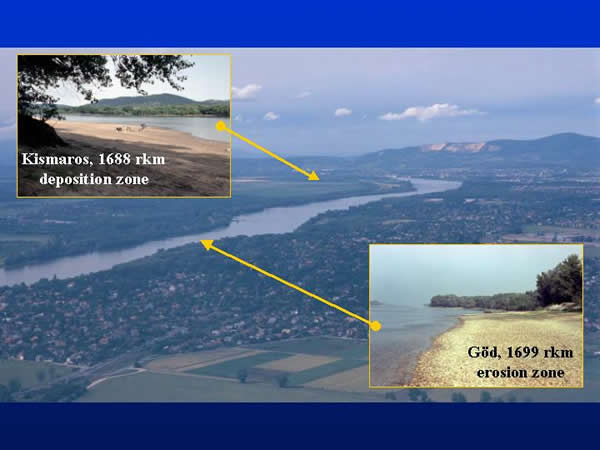
Fig. 1: Sampling areas in the Danube Bend
Four quantitative sampling techniques – Surber sampler (S - 0,25x0,25 m), triangular shape dredge (D - 0,25 m), Ekman-Birge grab (G - 0,15x0,15 m) and Petersen grab (P - 0,3x0,3 m) – were compared in five repetitions. Because of the comparison, the kicking and sweeping water net (H - 0,4 m), which is routinely used in stream waters (EU ISO-7828 type), was also applied. The dimensions of each sampler are in the parentheses. The five repetitive samples taken by the different methods were randomly elaborated on a 100x10 metre area at both sections. The areas covered by the different samplers were different (Fig. 2.). In the case of the triangular shape dredge and the kicking and sweeping water net the sampled surface area is the product of the opening width of the sampler and the dragging length (5 metres). For the evaluation the individuum numbers provided by the different samplers were uniformly converted for square metre.
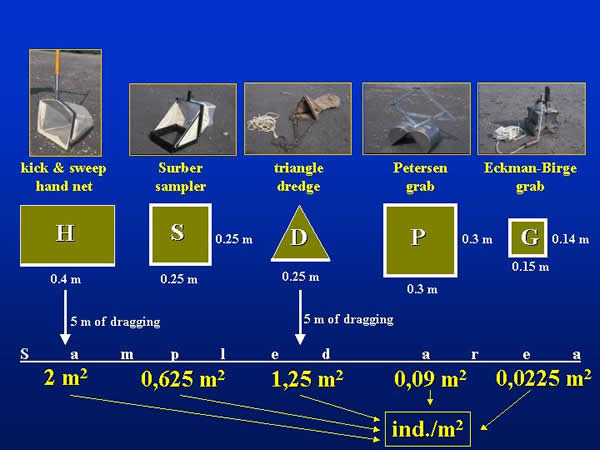
Fig 2: Comparison of sampled areas provided by the different equipments
Number of taxonomic groups
The following 16 taxonomic groups were found in the samples (the codes in parenthesis will be referred during the whole text): Bryozoa (BRY), Platyhelminthes (PLA), Gastropoda (GAS), Lamellibranchiata (LAM), Polychaeta (POL), Oligochaeta (OLI), Hirudinea (HIR), Mysidacea (MYS), Isopoda (ISO), Amphipoda (AMP), Ephemeroptera (EPH), Odonata (ODO), Heteroptera (HET), Trichoptera (TRI), Diptera (DIP) and Chironomidae (CHI). At Kismaros all of the 16 groups were present, while at Göd the water bugs were absent. The number of taxonomic groups collected by different samplers differed at 10 and 5 % level of significance at Kismaros and Göd, respectively. Considering the cumulative group numbers of the repetitions, dredge (D) proved to be the most powerful sampling device at Kismaros, which were followed by the kicking and sweeping net (H), Petersen garb (P), Eckman-Birge grab (G) and Surber sampler (S) in the appropriate place. At Göd the kicking and sweeping net was the most effective that were followed by the Petersen grab, dredge, Eckman-Birge grab and Surber sampler in the order of decreasing effectiveness. In every case, the figures of the effectiveness at Göd were smaller than at Kismaros (Fig. 3.).
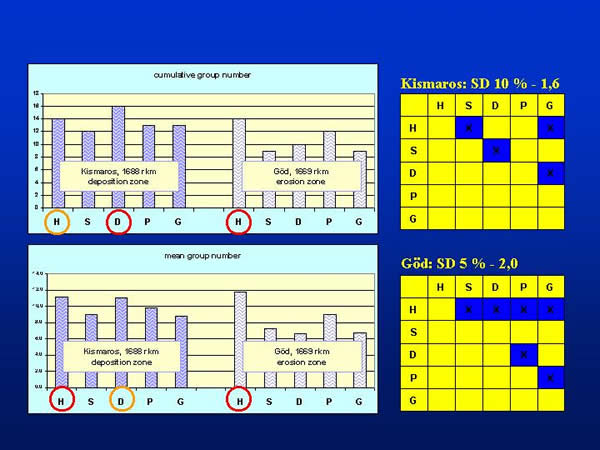
Fig. 3: Cumulative and mean group numbers provided by the different sampling techniques
The mean group number plotted against the sampled areas characteristic for the different sampling devices demonstrate a logarithmic curve (Fig. 4.), which corresponds to the well-known “species-area” relationship (KOBAYASHI 1979). At Kismaros, the curve could be fitted significantly at 0,1 % level of significance. At Göd the shape of curve was similar to that of Kismaros, but it does not fitted significantly (Göd – A). Omitting the figure of dredge sampling the curve fitted also significantly at 0,1 % level of significance at this place (Göd - B).
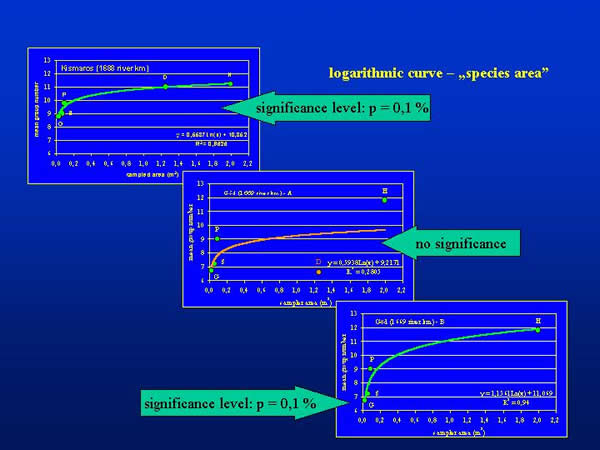
Fig. 4: Mean group numbers plotted against sampled area of different sampling devices (Surber sampler: S; dredge: D; Ekman-Birge grab: G; Petersen grab: P; kicking and sweeping water net: H)
The different quantitative sampling methods referring to the surface area are comparable only in the case of substrates with identical or similar texture. The grab or dredge samplers penetrate into different depths of the sediment, depending on the substrate texture and consistency, and the volume of the samples still differ in spite of the same surface area. The effectiveness – the “catching strategy” – of the individual methods could even more modify the results, as for example could be seen in the case of the dredge at Göd.
Total individuum number
Altogether, 53172 and 9683 specimens of the 16 and/or 15 taxonomic groups were collected by the different sampling techniques at Kismaros and Göd, representatively. Regarding the total individuum numbers per square metre (not taking into consideration the differences between the groups) Petersen (P) and Eckman-Birge (G) grab proved to be the most effective sampler, these were followed by the Surber sampler (S), the kicking and sweeping net (H) and the dredge (D). The sequence of the effectiveness was the same at both sections of the Danube (Kismaros and Göd) despite of the large difference in the total individual number, and the percentage values were also similar (Fig. 5.)
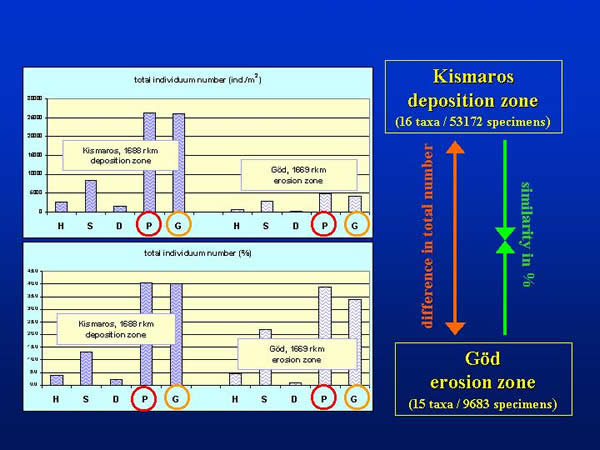
Fig. 5: Total individuum number and percentage values according different sampling methods
Individuum numbers within taxonomic groups
According to the mean values of all five sampling methods the specimens of Gastropoda, Lamellibranchiata, Oligochaeta and Chironomidae groups were found in the order of thousand, while the specimens of Polychaeta, Isopoda and Amphipoda groups were found in the order of hundred per square metre at Kismaros. Hirudinea, Ephemeroptera, Odonata, Trichoptera and Diptera representatives were present by tens; meanwhile the specimens of Platyhelminthes, Mysidacea and Heteroptera groups were very rare. At the Danube section of Göd the mean individuum number per square metre was the highest (more than thousand) in the group of Amphipoda. The representatives of Isopoda, Gastropoda, Lamellibranchiata and Oligochaeta groups were found in the order of hundred. The other groups occurred in the order of ten or with a few specimens. At Kismaros there were significant difference between the sampling methods in the case of the groups of Gastropoda, Lamellibranchiata, Polychaeta, Oligochaeta and Chironomidae at 0,05 % level of significance, in the case of the groups of Hirudinea and Isopoda at 0,1 % level of significance. At Göd significant difference can be found in the case of the groups of Gastropoda, Oligochaeta, Hirudinea, Isopoda, Amphipoda and Chironomida at 0,05 % level of significance (Fig. 6.).
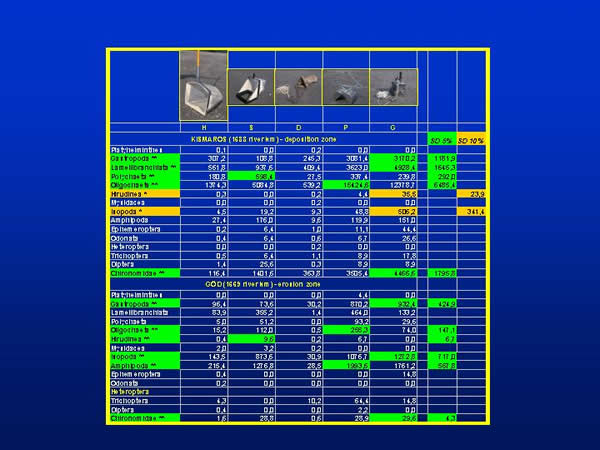
Fig. 6: Individuum numbers within taxonomic groups and the significant differences between sampling techniques
Comparison of the sampling areas
The primary object of our investigations was to compare the sampling effectiveness of different methods under consideration. Because of the differences in their hydrology and material cycling, the sampled Danube sections could be compared according their different habitats, too. There was no significant difference between the numbers of taxonomic group found at both sections, but the sections considerably differed in the total individuum number and in the individuum numbers within taxonomic groups. The soft sediment in the deposition zone of Kismaros was favourable to the Lamellibranchiata, Polychaeta, Oligochaeta, Gastropoda, Diptera and Chironomidae groups, which density was multiple of the same groups living in the section of Göd. However, the groups of Amphipoda, Isopoda, Mysidacea and Trichoptera, which prefer the hard and coarse substrate, occurred in higher individuum numbers at the latter place (Fig. 7.).
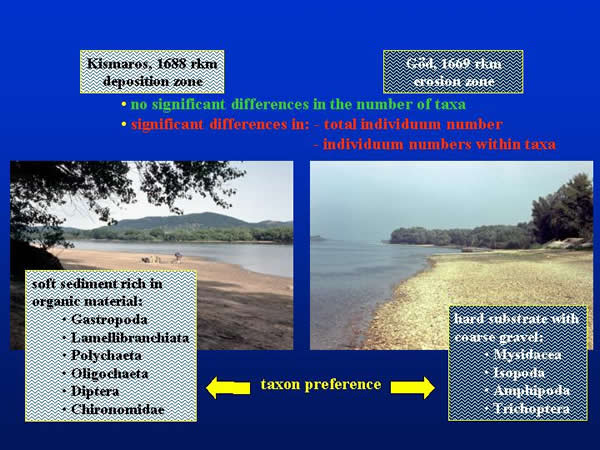
Fig. 7: Comparison of the sampling areas by sediment characteristics, taxa and individuum number, and taxon preference
Conclusions
The differences between the numbers of the taxonomic groups arose from the different surface areas provided by the different methods. The kicking and sweeping technique proved to be the most effective qualitative sampling treatment on coarse texture substrate, while the dredging offered similar or better results on soft sediment. The Surber sampler was the less effective method, irrespective of the substrate consistency. For quantitative sampling the grab samplers proved to be most efficient in the case of almost all taxonomic groups independently from the texture of sediment. Dredging was the less powerful method in quantitative sampling. In soft sediment, in the case of the Lamellibranchiata, Isopoda, Amphipoda, Ephemeroptera, Odonata, Trichoptera and Chironomidae specimens the Ekman-Birge grab, while in the case of the Oligochaeta and Polychaeta specimens the Petersen grab proved to be the most effective sampler. In the case of the Gastropoda group there was no notable difference between the efficiency of the two grab samplers. In coarse sediment, in the case of the Lamellibranchiata, Amphipoda, and Trichoptera specimens the Petersen grab, while in the case of the Isopoda crustaceans the Ekman-Birge grab proved to be the most effective sampler. In the case of the Gastropoda and Chironomidae group there was no notable difference between the efficiency of the two grab samplers (Fig. 8., 9.)
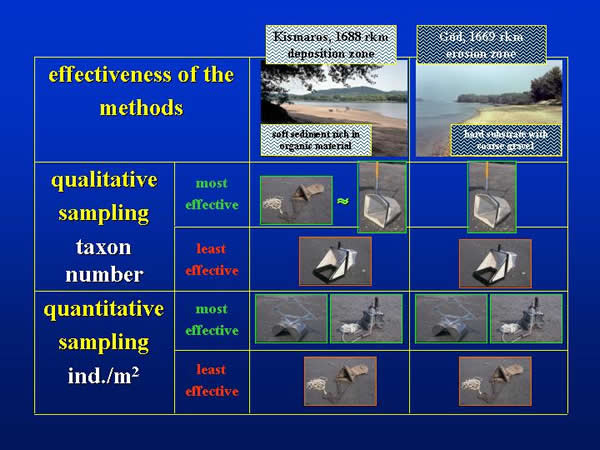
Fig. 8: Qualitative and quantitative effectiveness of sampling techniques on different natural substrates
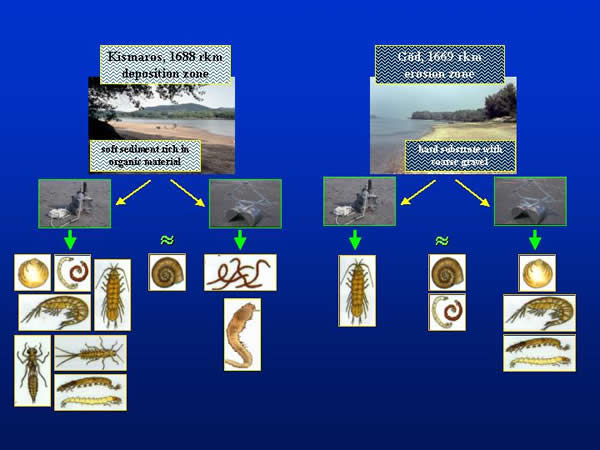
Fig. 9: Effectiveness of grab samplers according taxonomic groups on different natural substrates
Sampling of macroinvertebrates by artificial substrates
Quantification of the macroinvertebrates should form an integral part either in the fundamental food web studies or in the scientifically sound water quality assessment. The representative quantitative sampling meets numerous difficulties and uncertainties in stream waters, especially in large rivers. The routine use of these laborious methods is primarily effective in the littoral zone of the rivers (DAVIES 2001). At the same time, this habitat is extremely exposed to the fluctuations caused by the water regime. Artificial substrate provides non-destructive quantitative sampling techniques in many habitats, where other methods are not effective (ROSENBERG & RESH 1982). Communities colonized on artificial substrates are useful indicators of water quality (DE PAUW et al. 1986, WATANABE et al. 1988, OERTEL 1993). However, they can be suitable for water quality assessment in the only case, if they appear as representatives of natural substrate. With the knowledge of the colonization and selectivity – as prerequisite of the proper data interpretability – the shortcomings in the use of artificial substrates can significantly be reduced (NOSEK 2002, OERTEL 2002).
Two aspects of the artificial substrates were tested: their applicability, as quantitative sampling method and their selectivity compared to the natural substrate. In order to make this comparison, samples of the local macroinvertebrate communities were taken by the semi-quantitative “kick and sweep” water-net, which is a routinely used technique in biodiversity studies and in water quality assessment (DE ZWART & TRIVERDI 1992, HUMPRIES et al. 1998, MARCHANT & HEHIR 1999, TITTIZER 1999). Investigations were carried out in the Danube at Göd (1669 rkm), where the Danube has an erosion zone with a natural hard gravel substrate.
Containers with a volume of 5 litres were used for sampling. The type, size and arrangement of the used artificial substrates, the experimental layout, sampling frequencies, methods and the elaboration of the samples are described in former papers (OERTEL 2002, OERTEL & NOSEK 2003). In the present field experiments two types of location in space (water surface: S; river bottom: B), two types of substrate (gravel: G; clay granules: C) and the long-period-colonization (LPC) were used in three combinations: clay-surface-long-period-colonization (C-S-LPC), clay-bottom-long-period-colonization (C-B-LPC), gravel-bottom-long-period-colonization (G-B-LPC). In 2000, between 9th of May and 14th of November during a 210-day long-period-colonization samples were taken every three weeks. To collect the local fauna, the semi-quantitative “kick and sweep” method (K&S) was used at every third week in a longer period than the colonization process, between 18th of April and 27th of December (Fig 10., 11, 12.).
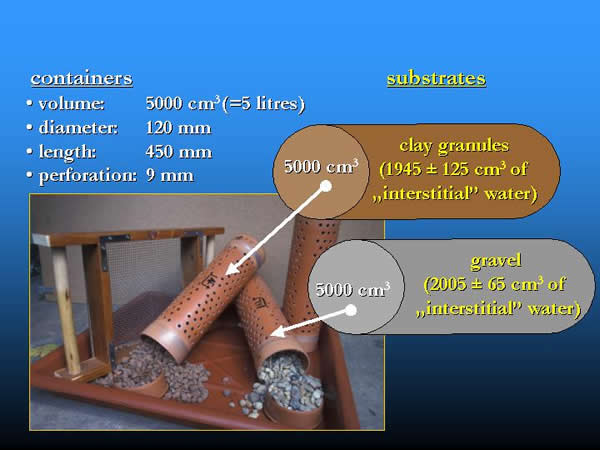
Fig. 10: Artificial substrates: containers filled with natural gravel and clay granules
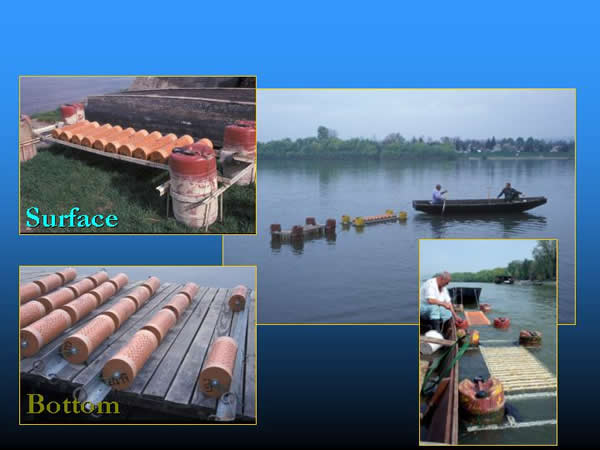
Fig. 11: Installing floating and submerged artificial substrates in the Danube
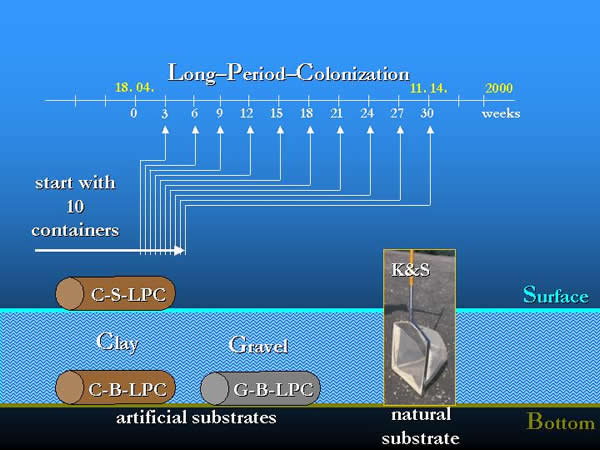
Fig. 12: The layout of the Long-Period-Colonization experiment with artificial substrates
The following calculation was used to compare the data of K&S samples (in individum m-2) referring to surface area and that of the artificial substrate samples (in individum l-1) referring to volume. A total area of 6 m2 (in three repetitions of 0.4 x 5 = 2 m2) was sampled by the K&S method (where 0.4 m was the opening width of the net and 5 m was the dragging length). Supposing that “kicked and swept” gravel layer of he bottom was not much deeper, than 2.5 cm, the sample volume is 150 litres (60000 cm2 x 2.5 cm = 150000 cm3). The volume is 30 times higher than the 5 litres volume of the artificial substrate containers. This minimum factor of 30 was used for the comparison of the different sampling methods, given the data in individum m-2, as unit. Of course, the factor could be higher, if the sampled layer was deeper (Fig 13.).
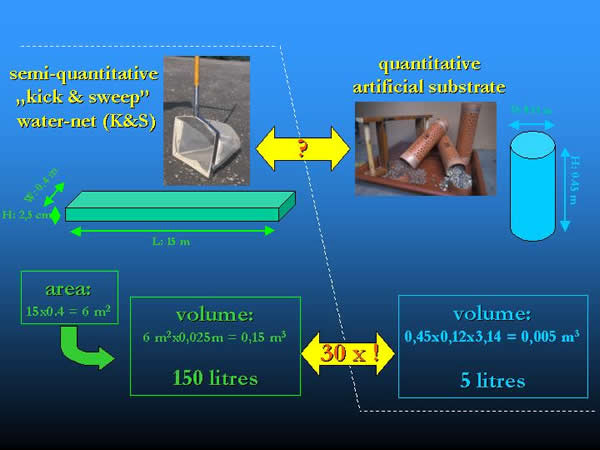
Fig. 13: Comparison and conversion of the area and volume provided by kick and sweep method and the artificial substrates
Qualitative results
14 taxonomic groups characterized the studied Danube-section in 2000. Two of these groups (Platyhelminthes and Mysidacea) are frequent on the natural gravel substrate of the riverbed, except on artificial substrates. The cumulative group number was 14 in the case of K&S method and was 12 in the case of all artificial substrates, during the period of the colonization experiment. K&S provided also the highest mean group number (12.3), while it was lower in the case of artificial substrates (9.7, 8.6, 9.7 in the order of C-S-LPC, C-B-LPC and G-B-LPC, respectively). The mean group numbers which characterized the clay substrate on the surface and the gravel substrate on the bottom were higher than in the previous year, while at the bottom in the case of clay granules filled containers, they were almost the same. In an other experiment, considering its cumulative and mean group numbers, the semi-quantitative K&S method (14.0; 11.8) also proved to be more effective compared to the quantitative sampling of macroinvertebrates by Surber sampler (9.0; 7.2), dredge (10.0; 6.6) or Petersen and Ekman-Birge grabs (12.0; 9.0, 9.0; 6,7, respectively) at the hard gravel substrate of the Göd section (cf. Fig. 3.) (OERTEL & NOSEK 2004).
In 1999, during our long period colonization experiments, which were elaborated in the same way, we learnt that the colonization process was more rapid in the more balanced environment of the river bottom, mainly in the containers filled with clay granules. The time needed to achieve a steady-state community provided to be almost four months on the surface, about one week on clay and one and half months on gravel at the bottom (NOSEK 2002). In 2000, the colonization happened similarly to that one which characterised the clay substrate at the bottom in 1999, in all three combinations of artificial substrates. The communities colonized the artificial substrates within a week or two, and the maximum of the taxonomic group numbers appeared also earlier than in the previous year. It is most likely, that the yearly differences in the hydrological regime could also affect the course of the colonization. In 2000, compared to 1999, the colonization experiment was preceded by a three-month high water period, in which the water level was 150-200 cm higher than the average of the previous 40 years. Parallel with the increased water discharge, the increased drift speeded up the process of colonization. The effect of water regime on the natural substrate was also traceable (Fig. 14.).
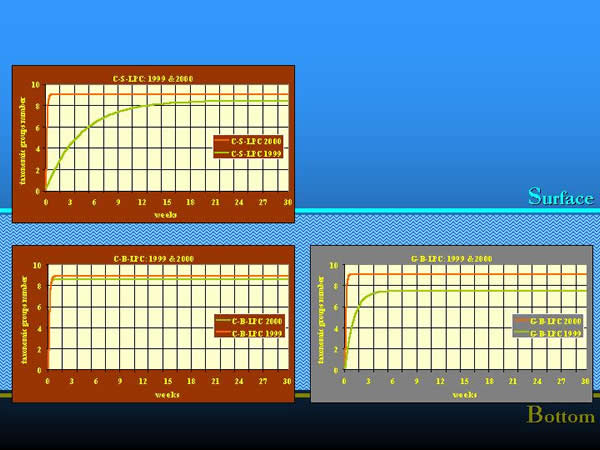
Fig. 14: Colonization process in different years and by different water regimes
Quantitative results
Considering the total individuum number of organisms a few orders of magnitude differences were found between the quantities collected by K&S method and by artificial substrates (Fig. 15.). At the bottom, clay substrate always provided the greatest number of organisms in the order of ten thousand (except in the 24-27 week period of the colonization), gravel substrate took the second place. Among artificial substrates, clay granules on the surface had the minimum number of organisms, except the last sampling in November. The total number of the organisms continuously increased on the natural substrate during the whole studied period, while it increased on the artificial substrates at the bottom and on the surface up to the beginning of September and October, respectively.
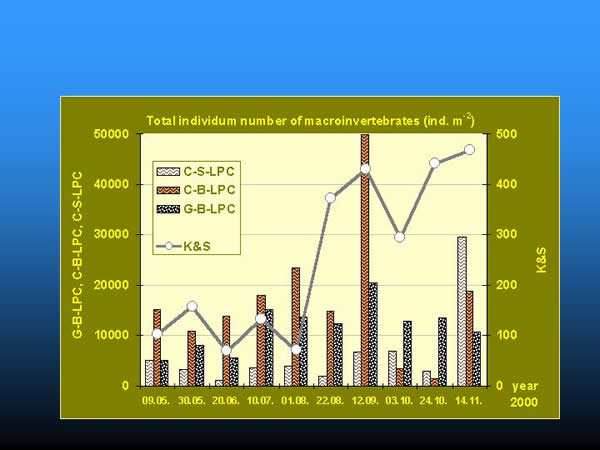
Fig. 15: Comparison of total individuum numbers collected by kick and sweep method and artificial substrates
Different taxonomic groups contributed different quantities to the total number of organisms in space and time. The effect of selectivity appeared in the composition and percentage of the taxonomic groups constituting the macroinvertebrate community, and also in the total number of organisms (Fig. 16.).
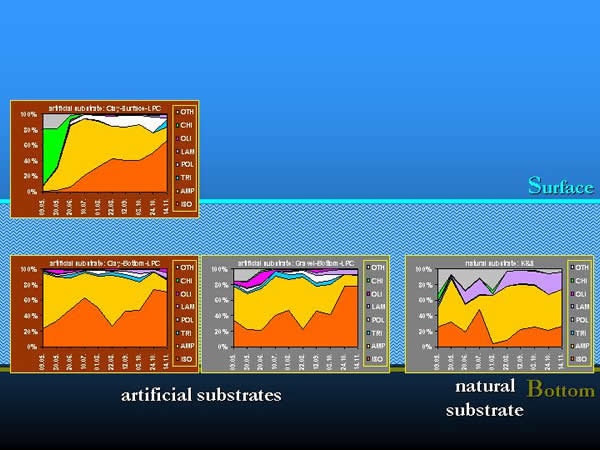
Fig. 16: Selectivity of artificial substrates by taxonomic groups
Conclusions
The results proved the differences in the macroinvertebrate community composition, which were caused by the artificial substrate, as quantitative sampling method. In the experimental arrangement selectivity was found between the natural and artificial substrates and within these latter ones by the type of substrates and their spatial location (CASEY & KENDALL 1996). The yearly changing colonisation of the given macroinvertebrate community – being under the effect of abiotic and biotic processes – could also have an influence on selectivity.
The easy to use, semi-quantitative K&S method proved to be more suitable for qualitative sampling (e.g. for biodiversity studies) in the littoral zone of the River Danube, too, when the actual water regime made it possible. If quantitative and reproducible samples are needed to take during the circumstances of fluctuating water level or in deep waters of the river, one should favour the easily standardiseable artificial substrates, rather than K&S. Knowing the effects of selectivity and colonization the appropriate method should be chosen to sample the subset of the macroinvertebrate community in question. In the case of water quality assessment (e.g. accumulation monitoring of pollutants) artificial substrates – due to the increased number of organisms caused by selectivity – are especially suitable for the mass collection of test organisms.
References
- CASEY, R.J. & KENDALL, S.A., 1996: Comparison among colonization of artificial substratum types and natural substratum by benthic macroinvertebrates. - Hydrobiologia 341:57-64.
- DAVIES, A., 2001: The use and limits of various methods of sampling and interpretation of benthic macroinvertebrates. - In: O. RAVERA. (Ed.), Scientific and legal aspects of biological monitoring in freshwater: J. Limnol. 60. (Suppl. 1): 1-6.
- DE PAUW, N., DIRK, R. & FONTOURA, A.P., 1986: Use of artificial substrates for standardized sampling of macroinvertebrates in the assessment of water quality by Belgian Biotic Index. - Hydrobiologia 133:237-258.
- DE ZWART, D. & TRIVERDI, R.C., 1992: Manual on Water Quality Evaluation. - RIVM, Bilthoven, The Netherlands, 217 pp.
- DYNESIUS, M. & NILSSON C. (1994): Fragmentation and flow regulation of river systems in the northern third of the world. - Science 266:753-762.
- HUMPHRIES, P., GROWNS, J.E., SERAFINI, L.G., HAWKING, J.H., CHICK, A.J. & LAKE, P.S., 1998: Macroinvertebrate sampling methods for lowland Australian rivers. - Hydrobiologia 364:209-218.
- KOBAYASHI, S. (1979): Species-area curves. - In: ORD, J.K., PATIL, G.P., TAILLIE, C. (Eds): Statistical Ecology Series 4:349-368.
- MARCHANT, R. & HEHIR, G., 1999: A method for quantifying hand-net samples of stream invertebrates. - Mar. Freshwater Res. 50:179-182.
- NOSEK, J.N., 2002: Macroinvertebrate studies at the Hungarian Danube section 4. The colonization dynamics of macroinvertebrates on different substrates. - Internat. Assoc. Danube Res. 34:317-326.
- OERTEL, N., 1993: The applicability of Cladophora glomerata (L.) Kütz. in an active bio-monitoring techniques to monitor heavy metals in the river Danube. - The Science of the Total Environment, Suppl. 2:1293-1304.
- OERTEL, N., 2002: Macroinvertebrate studies at the Hungarian Danube section 3. Artificial substrate as a tool to study macroinvertebrate colonization. - Internat. Assoc. Danube Res. 34:327-336.
- OERTEL, N. & NOSEK, J., 2003: Bioindication by macroinvertebrates in the Danube. 8. The applicability of artificial substrates for biomonitoring. - Hidrológiai Közlöny 83:101-104. (in Hungarian).
- OERTEL, N. & NOSEK, J.N., 2004: Comparative analysis of quantitative macroinvertebrate sampling techniques. - Internat. Assoc. Danube Res. 35:173-180.
- ROSENBERG, D.M. & RESH, V.H., 1982: The use of artificial substrates in the study of freshwater benthic macroinvertebrates. p. 175-235. - In: J., Jr. CAIRNS, (Ed.): Artificial substrates. Ann Arbor Science.
- SCHÖNBORN, W. (1992): Fließgewässerbiologie. - Fischer Verlag pp. 504.
- TITTIZER, T. (1999): Benthos. - In: TÜMPLING, W., FRIEDRICH, G. (Eds): Methoden der biologischen Wasseruntersuchung. p. 133-153. Jena. Stutgart. Lübeck. Ulm. G. Fischer Verlag
- UN/ECE (1995): Biological assessment methods for watercourses. Task Force on Monitoring & Assessment. Draft Report III. TF 3.05. :1-62. RIZA, Lelystad, the Netherlands.
- VANNOTE, R.L., MINSHALL, G.W., CUMMINS, K.W., SEDELL, J.R. & CUSHING, C.E. (1980): The River Continuum Concept. - Can. J. Fish. Aquat. Sci. 37:130-137.
- WATANABE, T., CAPBLANCQ, J. & DAUTA, A., 1988: Utilisation des bioessais „in situ” (substrats artificiels) pour caracterisér la qualité des eaux de rivière à l’aide du périphyton. - Annls. Limnol. 24:111-125.